
In our 2026 Outlook: The Policy Engine, we listed several risks to stocks that could prevent the S&P 500 from achieving our forecast for high-single-digit returns in 2026 (to a fair value target range of 7,300–7,400). One was narrow stock market leadership. Well, as mega cap technology leadership faded in recent months, the cyclicals and defensives picked up the slack. The traditional market-cap-weighted S&P 500 Index is down 1.5% year to date as of March 6, 2026, but the average stock in the index is up 3.2%.
Another risk we cited was a potential artificial intelligence (AI) bubble. Although scrutiny on AI and fears of business model disruption have increased, we wouldn’t call AI a bubble with NVIDIA (NVDA) shares trading at a price-to earnings ratio (P/E) of 21.6 based on the consensus earnings estimate over the next four quarters (by no means is this a recommendation, but NVDA grew revenue more than 70% and nearly doubled its net income last quarter). Rising interest rates and midterm elections, both largely non-factors so far, were also on our 2026 risk list.
What about geopolitical risk? Yes, it was there, too. Last week reminded us why geopolitical threats should always be on lists of risks from Wall Street strategists. It’s just a matter of time before it comes around again. Our key message for investors dealing with these unnerving headlines and market volatility is simple. Be patient. Stay diversified. Maintain balanced portfolios that include some investments well-positioned for volatility. Look for opportunities on the other side. Those who ride out the ups and downs, in time, will be grateful they did.
Checking the Oil Under the Hood
It’s difficult to separate the human and emotional side of war from the economic and market impacts. Without minimizing the human element, we focus on markets here. From that perspective, the energy market is the primary way through which this crisis will affect markets globally. Oil and natural gas production and transit have already been disrupted, sending prices sharply higher. If these disruptions are severe and long lasting, they have the potential to influence inflation expectations, weigh on business confidence, and elevate volatility across asset classes, all of which will likely translate into lower stock prices. Simply put, the more intense and prolonged the geopolitical shock, the larger the likely market impact.
The center of this crisis lies in the Strait of Hormuz, a vital waterway that carries 20% of the world’s oil supply. Oil and liquified natural gas (LNG) traffic through the strait is at a standstill, but at this point we don’t have any reason to expect the logjam to continue for more than a few weeks. That should hopefully give the Trump administration and allies in the Persian Gulf region enough time to eliminate, or dramatically reduce Iran’s drone stockpile and missile launch capabilities, better defend against Iran’s drone attacks on oil tankers, and ensure the ships can pass through. For a persistent rise in crude prices to materialize, markets would likely need evidence of a more prolonged shutdown of the Strait. President Trump controls the timeline here, but in the fog of war, timelines can change.
Bottom line: Watch the flow of oil and oil prices to gauge the effects of the conflict on economic growth and inflation. A meaningful escalation could potentially disrupt energy markets enough to push oil prices well over $100 a barrel and keep them there. A dozen countries have already been hit by Iranian strikes. This scenario remains unlikely in our view, especially in a midterm election year, but it’s possible. We’ve already seen the Trump administration grant India a 30-day waiver to import Russian oil to help alleviate some of the upward pressure on oil prices. More actions by the administration to contain oil prices are forthcoming.
Oil Prices Surged, Strait of Hormuz Tanker Traffic at a Standstill
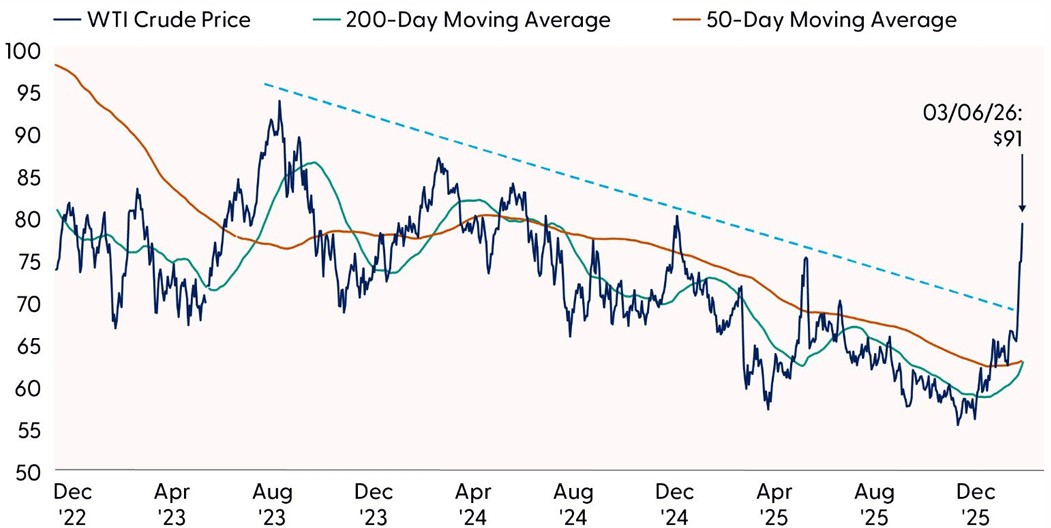
Source: LPL Research, Bloomberg 03/05/26
Disclosures: Past performance is no guarantee of future results. Any commodities, options, or futures referenced are being presented as a proxy, not as a recommendation.
Stocks Have Historically Been Resilient During Geopolitical Crisis Events
Periods of geopolitical conflict understandably cause nervousness among investors. This conflict has already widened beyond most in the Middle East in recent memory, as Iran retaliated by launching a wave of missiles at not just Israel but many of its neighbors in the Gulf, including Bahrain, Kuwait, Qatar, Saudi Arabia, and the UAE (targeting mostly U.S. military bases in the region). Some Gulf oil production facilities and oil tankers in the region have been damaged. Iraq, Kuwait, and the UAE have started cutting oil production. Shipping traffic through the Strait of Hormuz remains at a standstill. Concerns of a prolonged conflict with lasting disruption to energy markets have prompted the White House to promise naval escorts, insurance, and other measures to contain oil prices.
While no one knows when or how this conflict will end — or what Iran will look like after it’s over — we know markets don’t like uncertainty. However, the stock market has demonstrated remarkable resilience in the face of major geopolitical shocks in the past. Our review of more than eight decades of market reactions to 26 different geopolitical events is reassuring (see “The S&P 500 and Geopolitical Events: Mostly Short, Shallow Pullbacks” chart).
The S&P 500 has historically experienced pullbacks of only about 4.5% on average (median just 2.9%) after these geopolitical events, with markets typically stabilizing in less than a month. Markets tend to respond swiftly to uncertainty, but then they tend to regain their footing sooner than most investors expect. Stocks typically take the elevator down, and the escalator up in situations like this, but the ride typically doesn’t take long. The exception, as illustrated in the study, is when the U.S. economy enters recession, as in 1990 and 2001. That is not our expectation this time, although if oil prices exceed $100 per barrel and stay there for an extended period of time, recession odds would certainly increase.
The S&P 500 and Geopolitical Events: Mostly Short, Shallow Pullbacks
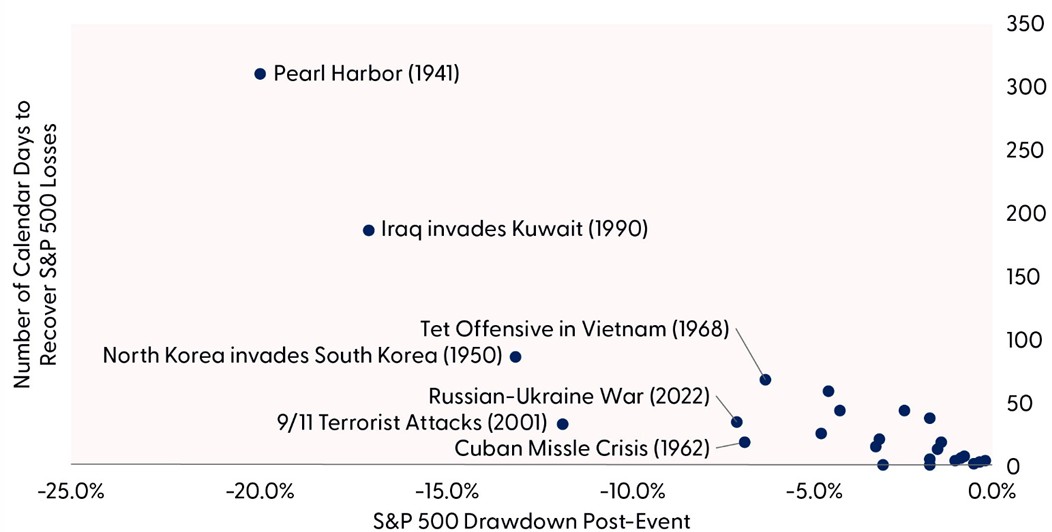
Source: LPL Research, Bloomberg, FactSet, S&P Dow Jones Indices, CFRA, Strategas 03/05/26 Disclosure: All indexes are unmanaged and cannot be invested in directly. Past performance is no guarantee of future results. The modern design of the S&P 500 index was first launched in 1957. Performance before then incorporates the performance of its predecessor index, the S&P 90. Chart data includes 26 events in total. Events not labeled include Hungarian uprising (’56); Suez crisis (’56); Kennedy Assassination (1963); Gulf of Tonkin Incident (’64); Six-Day War (’67); Munich Olympics (’72); Yom Kippur War (’73); Reagan shot (’81); Madrid bombing (’04); London Subway bombing (’05); Boston Marathon Bombing (’13); Syria Bombing (’17); North Korea Missile Crisis (’17); Saudi Aramco Drone Strike (’19); Iranian General killed in Airstrike (’20); U.S. Pulls Out of Afghanistan (’21); Israel-Hamas War (’23); U.S.-Israeli Airstrikes of Iran Nuclear Sites (’25).
Consistent with history, stocks have been resilient so far as the S&P 500 fell just 2% last week. There are several reasons for that, including: 1) the stock market’s well-known track record of shrugging off geopolitical events; 2) U.S. energy independence; 3) the expectation that the conflict will be relatively short–lived; and 4) the rebound in technology, notably software, after struggling with AI disruption fears over the prior two weeks. Chalk that up to good underlying fundamentals.
While the situation in the Middle East remains fluid, and high oil prices are starting to weigh some on the economy, this energy shock is unlikely to lead to a recession. President Trump controls the timeline, and as the economic and human costs of the conflict rise, the political incentives to halt the attacks will get stronger. The path of oil prices, the duration of the conflict, and the nature and effectiveness of retaliatory actions could contribute to continued market volatility.
The global economy is unlikely to be derailed. In the short-term, the U.S. markets offer a relatively safer port in the storm relative to Asian and European markets, which are more dependent on imported oil and gas.
What Can We Learn About Volatility From the VIX
The developing war in Iran has ushered in an additional layer of uncertainty for markets. Fear of a prolonged conflict in the Middle East and subsequent inflation shocks from surging oil prices have rattled investor sentiment. The CBOE Volatility Index, or more commonly referred to as the VIX, helps assess the level of fear priced into equity markets. This index represents implied 30-day volatility derived from the aggregate values of a weighted basket of S&P 500 puts and calls over a range of strike prices. Essentially, based on the price of the options, it tells us where the S&P 500 could be headed over the next 30 days. Generally, a rising VIX is associated with increased fear and uncertainty in the marketplace as well as falling stock prices, and vice versa for a declining VIX.
Because volatility tends to revert to its long-term average, the VIX is most useful at its extremes. Low readings can indicate investor complacency, while high readings may suggest markets are nearing peak fear. The recent jump in implied volatility has pushed the VIX to its highest point since last fall. A decisive move above the November closing high at 26.42 would imply additional upside risk in the fear gauge. Conversely, a failure to break above that level, particularly if it occurs alongside a shift back to a normal, upward-sloping VIX futures curve, could indicate that fear is topping out. At present, the futures curve is in backwardation, with near-term contracts priced above longer dated ones, a rare pattern typically associated with acute market stress. A return to contango, the normal shape of the curve in which longer-term futures trade at a premium to near-term contracts, would suggest that peak fear may have been reached. Plus, the volatility of the VIX does not reflect elevated longer-term fear, which we take as an encouraging sign that the market is confident that this conflict will be over in relatively short order and that lasting damage to global energy infrastructure will be limited.
Bottom line: Market volatility has spiked as geopolitical risks rise, pushing the VIX toward key resistance levels. If the futures curve normalizes and the VIX fails to break higher, it may signal that investor fear is nearing a peak.
Implied Stock Market Volatility Builds
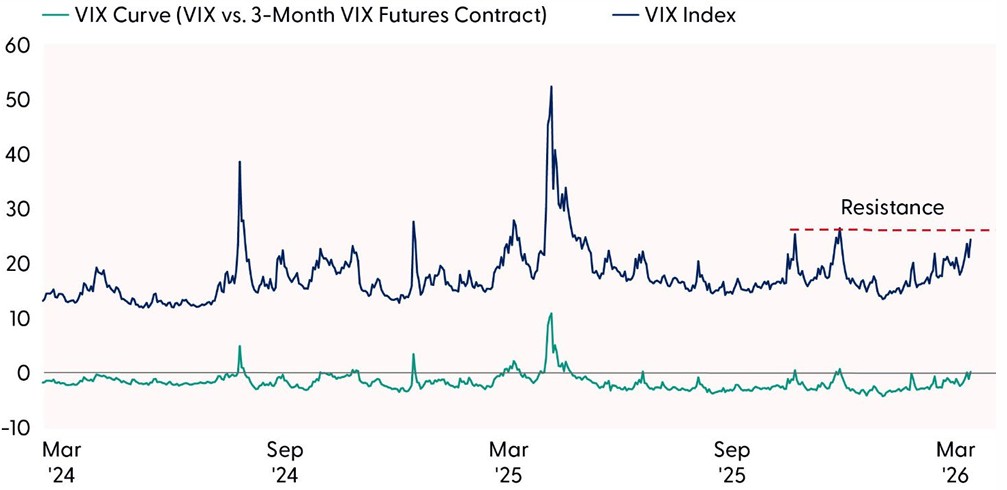
Source: LPL Research, FactSet 03/05/26
Disclosures: Indexes are unmanaged and cannot be invested in directly. Past performance is no guarantee of future results. Any commodities, options, or futures referenced are being presented as a proxy, not as a recommendation.
Conclusion
Geopolitical events are difficult. It’s human nature to want to sell stocks and sit in cash. How long this conflict will last and how much inflation it might cause as oil and gas prices rise are uncertain. For long‑term investors, we believe there may be some reassurance in market history. Geopolitical events, while unsettling, typically do not cause significant damage to diversified portfolios. Pullbacks are common, but history tells us that stocks will display their resilience on the other side after the fog of war clears. Staying focused on the fundamentals of the economy and corporate profits, maintaining balanced allocations, avoiding emotional decisions, and focusing on the long term can help investors navigate the coming weeks with confidence. We note that past performance does not guarantee future results.
We pray for a safe return home for our brave servicemen and women in the Middle East.
Asset Allocation Insights
LPL’s Strategic Tactical Asset Allocation Committee (STAAC) maintains its tactical neutral stance on equities. As the war in Iran continues and oil prices have moved sharply higher, investors may be well served by bracing for additional volatility. The stock market’s resilient track record during geopolitical crises is reassuring, leaving STAAC to look for opportunities to potentially add equities at lower levels rather than remove equities due to what will likely be short-term market disruption. Technically, the broad market’s long-term uptrend remains intact.
STAAC’s regional preferences across the U.S., developed international, and emerging markets (EM) are aligned with benchmarks. Attractive valuations in non-U.S. equities are offset by upward pressure in the U.S. dollar, although the Committee continues to watch EM closely for opportunities due to improvements in fundamentals and the technical analysis picture pre-Iran conflict.
The Committee still maintains a slight preference for growth over value and large caps over small caps. In terms of domestic sectors, communication services remain an overweight, while the Committee con
Within fixed income, the STAAC holds a neutral weight in core bonds, with a slight preference for mortgage-backed securities (MBS) over investment-grade corporates. The Committee believes the risk-reward for core bond sectors (U.S. Treasury, agency MBS, investment-grade corporates) is more attractive than plus sectors. The Committee does not believe adding duration (interest rate sensitivity) at current levels is attractive and remains neutral relative to benchmarks.
Important Disclosures
This material is for general information only and is not intended to provide specific advice or recommendations for any individual. There is no assurance that the views or strategies discussed are suitable for all investors or will yield positive outcomes. Investing involves risks including possible loss of principal. Any economic forecasts set forth may not develop as predicted and are subject to change.
References to markets, asset classes, and sectors are generally regarding the corresponding market index. Indexes are unmanaged statistical composites and cannot be invested into directly. Index performance is not indicative of the performance of any investment and do not reflect fees, expenses, or sales charges. All performance referenced is historical and is no guarantee of future results.
Any company names noted herein are for educational purposes only and not an indication of trading intent or a solicitation of their products or services. LPL Financial doesn’t provide research on individual equities.
All information is believed to be from reliable sources; however, LPL Financial makes no representation as to its completeness or accuracy.
All investing involves risk, including possible loss of principal.
U.S. Treasuries may be considered “safe haven” investments but do carry some degree of risk including interest rate, credit, and market risk. Bonds are subject to market and interest rate risk if sold prior to maturity. Bond values will decline as interest rates rise and bonds are subject to availability and change in price.
The Standard & Poor’s 500 Index (S&P500) is a capitalization-weighted index of 500 stocks designed to measure performance of the broad domestic economy through changes in the aggregate market value of 500 stocks representing all major industries.
The PE ratio (price-to-earnings ratio) is a measure of the price paid for a share relative to the annual net income or profit earned by the firm per share. It is a financial ratio used for valuation: a higher PE ratio means that investors are paying more for each unit of net income, so the stock is more expensive compared to one with lower PE ratio.
Earnings per share (EPS) is the portion of a company’s profit allocated to each outstanding share of common stock. EPS serves as an indicator of a company’s profitability. Earnings per share is generally considered to be the single most important variable in determining a share’s price. It is also a major component used to calculate the price-to-earnings valuation ratio.
There is no guarantee that a diversified portfolio will enhance overall returns or outperform a non-diversified portfolio. Diversification does not protect against market risk.
The fast price swings in commodities will result in significant volatility in an investor’s holdings. Commodities include increased risks, such as political, economic, and currency instability, and may not be suitable for all investors.
All index data from FactSet or Bloomberg.
This research material has been prepared by LPL Financial LLC.
Not Insured by FDIC/NCUA or Any Other Government Agency | Not Bank/Credit Union Guaranteed | Not Bank/Credit Union Deposits or Obligations | May Lose Value
For public use.
Member FINRA/SIPC.
RES-0006767-0226 Tracking #1075536 | #1075538 (Exp. 03/27)