
The growth vs. value debate has been pretty one-sided in 2022, with value outperforming growth for a sustained period for the first time in almost 15 years. However, the debate is heating up as investors begin to consider whether the pendulum will swing back to growth if inflation and interest rates decline in 2023. In this week’s Weekly Market Commentary we look at the factors driving value’s 2022 outperformance, the technical trading setup for growth and value, and what to look for in the coming months.
Value vs. Growth – Value Takes 2022
One equity market debate discussed frequently in the LPL Research Strategic & Tactical Asset Allocation Committee (STAAC) is the growth vs. value style reversal experienced the past 12 months. Until November of last year, value had underperformed growth for nearly 15 years. Since then, value has outperformed growth for the longest sustained period since 2003–2007. How long might the current period of value’s outperformance last, and what are the catalysts that could end this cycle and pivot the market’s favor back to growth?
First, a bit of background. Value and growth stocks are simply stocks that exhibit greater “value” characteristics (e.g., comparatively inexpensive relative to earnings) or “growth” characteristics (e.g., comparatively faster sales or earnings growth) than peers. In this commentary, we focus on the S&P 500 Value and S&P 500 Growth indexes, which are the value-growth-oriented segments of the popular U.S. large cap S&P 500 Index.
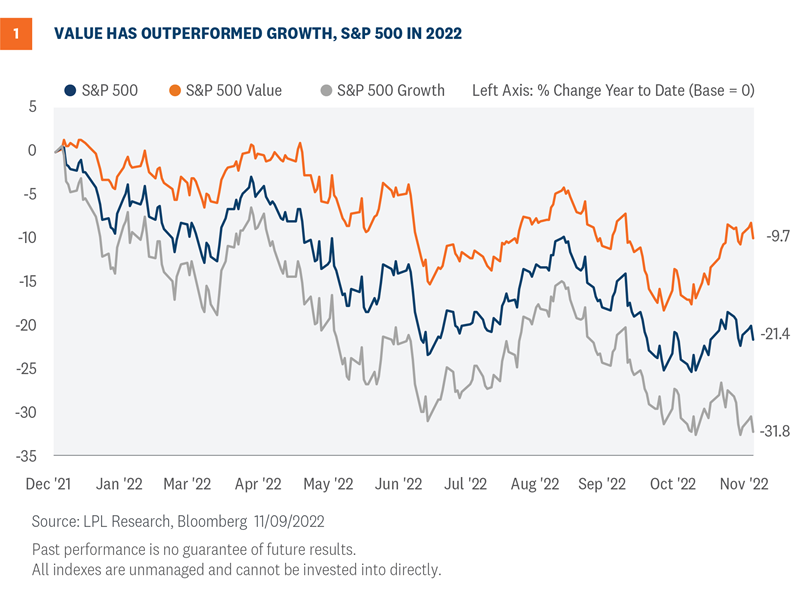
Second, the focus here is on relative performance. Value’s year-to-date performance is negative along with most every other asset class, just less negative than both the broad market (S&P 500) and significantly less negative than growth. Said another way, value has outperformed the broader market by ~10 percentage points year to date, and outperformed growth by ~20 percentage points year to date [Figure 1]. We will emphasize relative performance when analyzing what is driving value’s outperformance from a fundamental standpoint, and take a look at S&P 500 Value and Growth index price charts to analyze the technical setup.
Value Outperformance is Fundamentally Sound
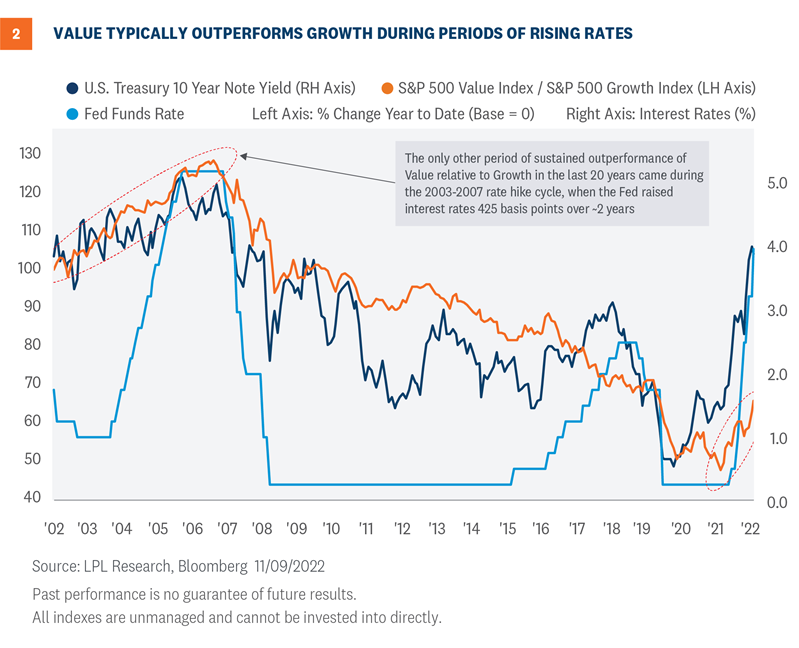
There are several factors driving value stocks’ outperformance over the last year. There are geopolitical factors such as the Russian invasion of Ukraine driving commodities higher (commodity-related companies’ stocks typically fall more heavily into the value bucket). There are also cyclical factors: as the business cycle enters the late innings and recession looms, defensive stocks tend to outperform, and defensive sectors such as consumer staples and utilities tend to skew toward value. And finally there are monetary factors, i.e., interest rates, Federal Reserve (Fed) policy, and inflation. The monetary factor is the factor we are focused on, as the two periods of sustained value outperformance in the last 20 years (now, and 2003-2007) coincide with the last two periods when both market interest rates (measured by the 10-year U.S. Treasury yield) and Fed policy rates rose dramatically [Figure 2].
The rising interest rate environment, driven by Fed policies to quell the highest inflation in decades, makes value stocks appear more attractive than growth stocks for several reasons, all of which make fundamental and logical sense.
- Future cash flows are devalued. Growth stocks typically trade at higher valuations on the premise that an investor is buying a company now that will grow to be a much larger company, producing higher levels of cash and profit in the future. Therefore, an investor is expected to pay a premium for near-term earnings and cash-flows on the expectation of higher levels of profit in the future. Rising interest rates decrease this value proposition by:
- Increasing the cost of capital for businesses, increasing capital investment costs required to fund the fast growth of the business, thus lowering returns
- Increasing the discount rate, which lowers the present value of future cash flows, and company valuations
- Less volatility amid rising rates. Value stocks are inherently cheaper than growth stocks, which can have several root causes, but typically the assumption is these companies have lower growth prospects, and therefore investors are primarily paying for cash flows and profits “in the here and now”. This tends to make the average value stock less sensitive to interest rates (similar to shorter maturity fixed income investments) compared to growth stocks and less volatile in rising rate environments.
- The “bird-in-hand” is more valuable. In addition to higher earnings yields (earnings per share / price), value stocks tend to have higher shareholder yields ([dividends + share buybacks] / market value) as well. This is capital returned to investors now, rather than being reinvested in the business amid rising interest rates. This supports the “bird-in-hand” theory of investor preference (based on the adage “a bird in the hand is worth two in the bush”), which states that investors prefer dividends over potential capital gains. Shareholder yield is compelling amid rising rates when low risk alternatives further up the capital structure (such as investment grade corporate bonds) are paying higher yields.
Of all the factors that have driven value’s outperformance, monetary policy is the one to watch over the next 12 months for the performance of value relative to growth. The Fed’s path forward on restrictive policy, guided by inflation and jobs data, will be a major contributor to whether value’s relative outperformance will continue.
Technical Setup for Value and Growth
The S&P 500 Value Index has Climbed Back to an Inflection Point
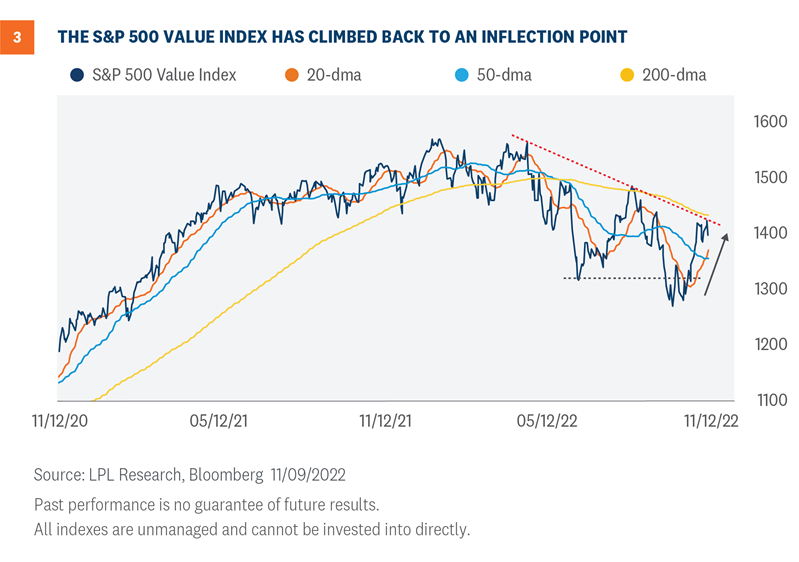
The technical setup for the S&P 500 Value Index (SVX) continues to improve. The recent rebound off support from the pre-pandemic highs has left the index at a key inflection point. A close above the declining 200-day moving average (dma) would reverse the current downtrend and leave the 1,487–1,494 range (May and August highs) as the next upside target. Participation in the recovery off the October lows has also been widespread. Over half of the SVX is now trading above their 200-dma and their June lows. In addition, momentum indicators remain bullish with limited signs of widespread overbought conditions, suggesting the current rally could have more room to run [Figure 3].
The S&P 500 Growth Index has Rolled Over at Resistance
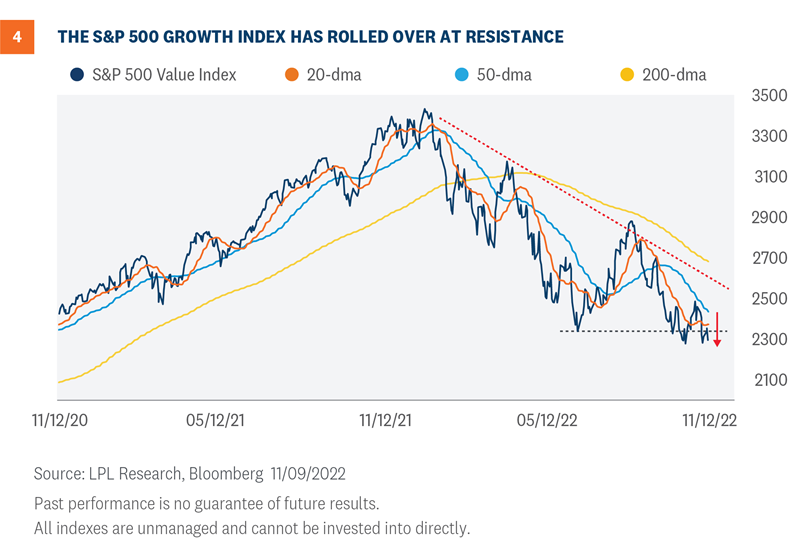
The technical backdrop for the S&P 500 Growth Index (SGX) remains challenged. Unlike the SVX, the index remains well below its current downtrend and continues to struggle with support off the June lows. Minor relief rallies off oversold levels have developed since October, but they have lacked sustainable upside momentum. While there has been some recent technical progress for the SGX, technical evidence pointing to a trend change remains limited at this juncture. [Figure 4].
Relative Strength
Ratio chart analysis comparing the S&P 500 Value Index (SVX) to the S&P 500 Growth Index (SGX) provides the most compelling technical evidence for value over growth. The SVX/SGX ratio chart has recently broken out from a bottom formation that has been under development since 2020. Furthermore, the pair has reversed a downtrend dating back to the 2007 highs. Rising 20-, 50-, and 200-day moving averages for the pair provides additional confirmation of an uptrend underpinned by value outperformance.
Conclusion
Value stocks’ price-to-earnings (P/E) ratios remain below their historic average discount to growth stocks’ P/E ratios, but the gap is closing as growth shares’ multiples compress at a faster rate than value shares’ multiples in the current bear market. However, as long as the Fed remains hawkish, keeping rates in restrictive territory to tamp down inflation, we believe value should continue to outperform growth, for all of the reasons outlined in this commentary. A slower pace of smaller rate hikes, and an ultimate pause in the hiking cycle, will be headwinds to value’s relative performance, but until there is a clear path that inflation is sustainably headed toward the Fed’s 2% long term target, value has a good chance to outperform growth. The LPL Research STAAC continues to favor a tilt toward value from an asset allocation perspective.
Thomas Shipp, CFA, Quantitative Equity Analyst, LPL Financial
Adam Turnquist, CMT, Chief Technical Strategist, LPL Financial
You may also be interested in:
- How Midterm Elections May Move Markets – November 7, 2022
- Federal Reserve Preview: TRICK or Treat? – October 31, 2022
- Three Things to Know About Recessions – October 24, 2022
IMPORTANT DISCLOSURES
This material is for general information only and is not intended to provide specific advice or recommendations for any individual. There is no assurance that the views or strategies discussed are suitable for all investors or will yield positive outcomes. Investing involves risks including possible loss of principal. Any economic forecasts set forth may not develop as predicted and are subject to change.
References to markets, asset classes, and sectors are generally regarding the corresponding market index. Indexes are unmanaged statistical composites and cannot be invested into directly. Index performance is not indicative of the performance of any investment and do not reflect fees, expenses, or sales charges. All performance referenced is historical and is no guarantee of future results.
Any company names noted herein are for educational purposes only and not an indication of trading intent or a solicitation of their products or services. LPL Financial doesn’t provide research on individual equities.
All information is believed to be from reliable sources; however, LPL Financial makes no representation as to its completeness or accuracy.
US Treasuries may be considered “safe haven” investments but do carry some degree of risk including interest rate, credit, and market risk. Bonds are subject to market and interest rate risk if sold prior to maturity. Bond values will decline as interest rates rise and bonds are subject to availability and change in price.
The Standard & Poor’s 500 Index (S&P500) is a capitalization-weighted index of 500 stocks designed to measure performance of the broad domestic economy through changes in the aggregate market value of 500 stocks representing all major industries.
The PE ratio (price-to-earnings ratio) is a measure of the price paid for a share relative to the annual net income or profit earned by the firm per share. It is a financial ratio used for valuation: a higher PE ratio means that investors are paying more for each unit of net income, so the stock is more expensive compared to one with lower PE ratio.
Earnings per share (EPS) is the portion of a company’s profit allocated to each outstanding share of common stock. EPS serves as an indicator of a company’s profitability. Earnings per share is generally considered to be the single most important variable in determining a share’s price. It is also a major component used to calculate the price-to-earnings valuation ratio.
All index data from Bloomberg.
This research material has been prepared by LPL Financial LLC.
Securities and advisory services offered through LPL Financial (LPL), a registered inv estment advisor and broker -dealer (member FINRA/SIPC). Insurance products are offered through LPL or its licensed affiliates. To the extent you are receiving investment a dvice from a separately registered independent investment advisor that is not an LPL affiliate, please note LPL makes no representation with respect to such entity.
Not Insured by FDIC/NCUA or Any Other Government Agency | Not Bank/Credit Union Guaranteed | Not Bank/Credit Union Deposits or Obligations | May Lose Value
RES-1333700-1122 | For Public Use | Tracking # 1-05346564 (Exp. 11/23)