
Inflationary dynamics continue to surprise to the upside, and markets now expect the Fed to pursue one of its most aggressive rate hiking campaign in years. U.S. Treasury yields continue to move higher as well. We think we’ve seen the biggest moves higher in yields, but as long as inflationary pressures continue to surprise to the upside, interest rate volatility will likely remain. We still think the 10-year Treasury yield can end the year between 2.75%-3.25%, but we acknowledge there are risks to the upside.
Last week’s higher than expected inflation report was a game-changer for the Federal Reserve (Fed) and bond markets. With inflationary pressures continuing to run much hotter than the Fed’s 2% target, an even more aggressive rate hiking campaign was priced into markets. Markets are now expecting at least a 75 basis point (bp) increase in its short-term interest rate at this week’s meeting and nearly another 100 bp of hikes in the two remaining meetings this year. Moreover, markets expect the fed funds rate to get to 4.5% by early next year.
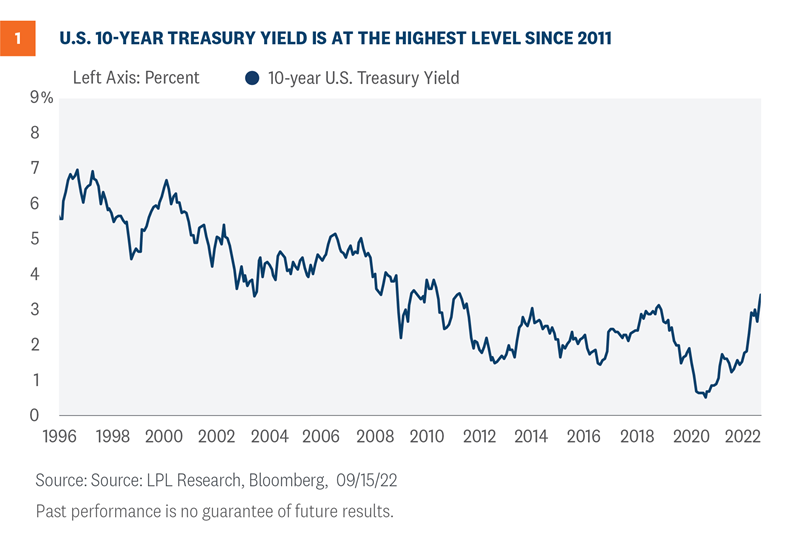
Because of the ever higher Fed rate hike expectations, the yield on the 10-year Treasury security has increased by nearly 200 bp this year after increasing around 100 bp in 2020 and is at the highest level since 2011 [Figure 1]. The nearly 300 bp move higher that has already taken place this cycle is the biggest move higher in yields since 1987, when rates moved higher by 320 bp. Since the 1980s, the average trough-to-peak increase in 10-year Treasury yields has been closer to 250 bp, but that includes large rate increases in early ‘80s when Treasury yields were much higher. Since 2000, the average increase in the 10-year yield has been around 1.8%. We’re clearly not in normal times, but the move on the 10-year Treasury yield since it bottomed in August 2020 has been significant.
Could rates still move higher? That will ultimately depend on the path of inflation. If inflation falls like we continue to expect it to, yields will likely fall as well. If inflation stays elevated and the Fed has to be even more aggressive than what is currently priced in, we could still see higher rates. However, as Fed rate hikes flow into the real economy, the risk of a recession increases, which should help bring down yields. As such, we still think the 10-year Treasury yield can end the year between 2.75%-3.25%, but we acknowledge there are risks to the upside.
The shape of the yield curve is not normal
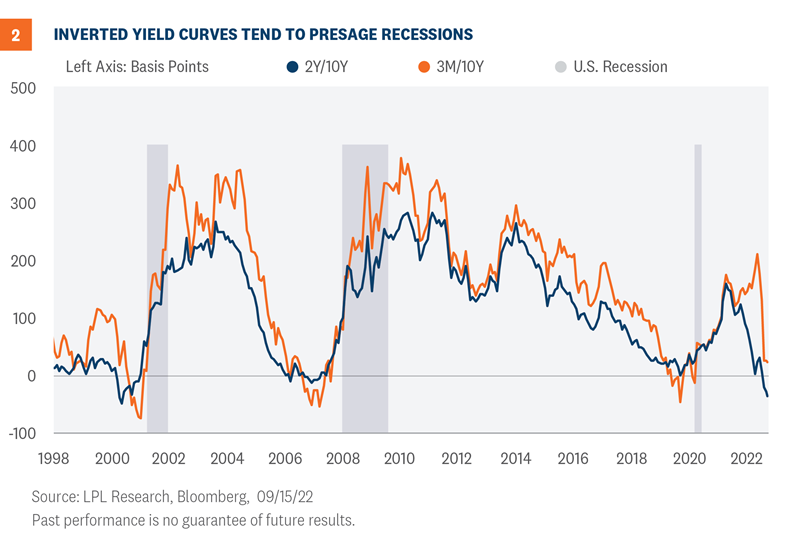
The shape of U.S Treasury yield curve is often looked at as a barometer for U.S. economic growth. More specifically, it reflects how the Fed intends to stimulate or slow economic growth by cutting or raising its policy rate. In “normal” times, the yield curve is upward sloping, meaning longer maturity Treasury yields are higher than shorter maturity Treasury yields. However, when the Fed wants to slow growth to contain inflation, shorter maturity securities could eventually out-yield longer maturity securities. This is referred to as an inverted yield curve, which has been a pretty reliable predictor of economic recessions.
Over the past six months, the Fed has been aggressively raising short-term interest rates in an effort to arrest these continued consumer price increases and deliberately slow the economy. So, when we look at the current yield curve [Figure 2], we see that the 2-year yield is out-yielding the 10-year Treasury yield and is thus inverted. Maybe more concerning though is that the 3M/10Y part of the yield curve is getting close to inversion as well, a signal with more academic backing. And as you can see on [Figure 2], over the past few decades economic recessions have occurred shortly after these yield curve inversions have taken place. Could this time be different? Sure, but as the Fed continues to push short-term interest rates higher to slow the economy, recession risks will remain a concern for investors. While we don’t think a recession is likely this year, we do think it’s roughly a 50/50 proposition in 2023. And as long as there are concerns about a slowing economy, we could see either stable or lower long-end rates.
Quantitative tightening (QT) is a wildcard
The Fed has stated that it would like to get its nearly $9 trillion balance sheet [Figure 3] back down to roughly 20% of U.S. GDP (it is currently closer to 40%), and as such, it is allowing up to $95 billion of Treasury and mortgage-backed securities to organically roll off its balance sheet as the bonds mature. It should be noted that the Fed is not initially planning on outright sales of securities to shrink its balance sheet; rather, it will only reduce the amount of reinvestments by using monthly caps. That is, the Fed will only allow its balance sheet to shrink incrementally over time while also paying attention to the impact QT is having on the banking system.
So what happens to the cash the Fed receives from principal repayments? Once Treasury bonds mature and Treasury pays the Fed for those bonds, those funds get taken out of the financial system completely. Similarly for MBS, the Fed transacts in the secondary market so once MBS either mature naturally or through prepayments, the funds not reinvested are removed from the financial system. The point of QT is to remove liquidity from the financial system (mostly through the banking channels) to tighten financial conditions, so whatever isn’t reinvested by the Fed is removed completely. The Fed takes the proceeds and simply extinguishes them. The reserves disappear from the banking system with a few keyboard strokes just as they appeared with a few strokes during QE.
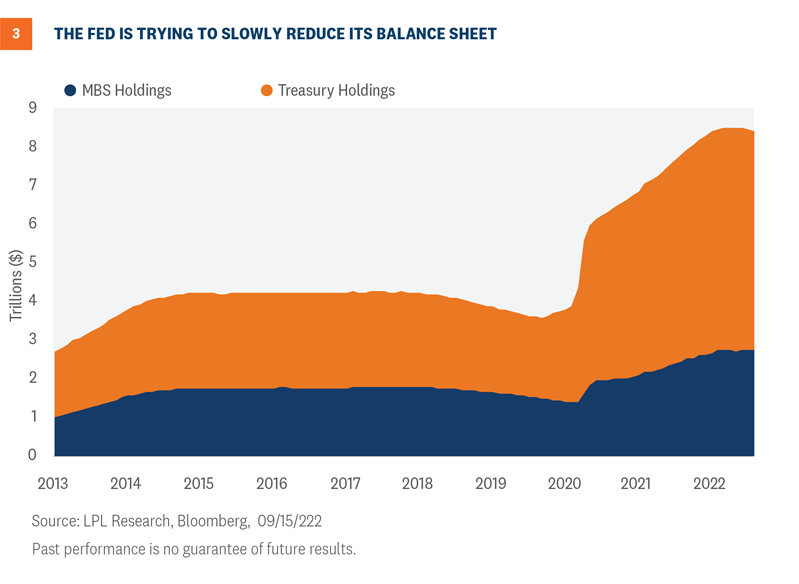
Importantly, the impact to the tightening of financial conditions in this way isn’t well known. Remember, this has only happened one other time. According to research from the Atlanta Fed, a $2.2 trillion passive reduction of the Fed’s balance sheet over three years would be equivalent to an increase of 29 bp to the fed funds rate in normal times (when are things ever normal?) but 74 bp in crisis times. So along with traditional rate hikes, it is expected that QT will tighten financial conditions by a few additional rate hikes.
The unanswered question remains, though: How far can the Fed actually go in reducing its balance sheet? Last time the Fed attempted to shrink its balance sheet, it was only able to remove roughly $750 billion of Treasury and mortgage securities before certain parts of the short-term funding markets, which are important corporate funding markets, experienced stress. Existing liquidity in many government bond markets remains poor, so the Fed will likely have to proceed cautiously to ensure the most important bond market—the Treasury market—remains fully functional. Given the pockets of illiquidity in the Treasury market, we could see yields gap higher if inflationary pressures continue to surprise markets.
Conclusion
The move higher in yields that we’ve experienced this year has been painful for fixed income investors—full stop. What was once thought of as a conservative investment has turned out to be anything but conservative this year. 2022 will go down as the worst year for bonds ever. Could yields go higher from current levels? A lot will depend on the path of inflationary pressures. If Fed rate hikes start to work and inflation starts to fall, then yields will likely fall as well. If inflation pressures remain stubbornly high, we’re likely to see higher yields as well.
If there is a silver lining to the move higher in yields this year, it is that now there are a lot more opportunities within fixed income that can help investors achieve their income objectives. In many markets, yields haven’t been this high in over a decade. Bonds are unique in their structures in that coupon and principal payments are, for the most part, guaranteed and the primary factors of long-term total returns. The price volatility we’ve seen so far this year doesn’t impact those payments. It will take time to offset the drawdowns fixed income investors have experienced this year for sure, but with higher yields, fixed income does provide income again.
Lawrence Gillum, CFA, Fixed Income Strategist, LPL Financial
You may also be interested in:
- Getting Jobs Market Back into Balance – September 12, 2022
- September’s Calendar Cruelty for Stocks – September 6, 2022
- Earnings Recap: Still Hanging In There – August 29, 2022
Click here to download a PDF of this report.
IMPORTANT DISCLOSURES
This material is for general information only and is not intended to provide specific advice or recommendations for any individual. There is no assurance that the views or strategies discussed are suitable for all investors or will yield positive outcomes. Investing involves risks including possible loss of principal. Any economic forecasts set forth may not develop as predicted and are subject to change.
References to markets, asset classes, and sectors are generally regarding the corresponding market index. Indexes are unmanaged statistical composites and cannot be invested into directly. Index performance is not indicative of the performance of any investment and do not reflect fees, expenses, or sales charges. All performance referenced is historical and is no guarantee of future results.
Any company names noted herein are for educational purposes only and not an indication of trading intent or a solicitation of their products or services. LPL Financial doesn’t provide research on individual equities.
All information is believed to be from reliable sources; however, LPL Financial makes no representation as to its completeness or accuracy.
US Treasuries may be considered “safe haven” investments but do carry some degree of risk including interest rate, credit, and market risk. Bonds are subject to market and interest rate risk if sold prior to maturity. Bond values will decline as interest rates rise and bonds are subject to availability and change in price.
The Standard & Poor’s 500 Index (S&P500) is a capitalization-weighted index of 500 stocks designed to measure performance of the broad domestic economy through changes in the aggregate market value of 500 stocks representing all major industries.
The PE ratio (price-to-earnings ratio) is a measure of the price paid for a share relative to the annual net income or profit earned by the firm per share. It is a financial ratio used for valuation: a higher PE ratio means that investors are paying more for each unit of net income, so the stock is more expensive compared to one with lower PE ratio.
Earnings per share (EPS) is the portion of a company’s profit allocated to each outstanding share of common stock. EPS serves as an indicator of a company’s profitability. Earnings per share is generally considered to be the single most important variable in determining a share’s price. It is also a major component used to calculate the price-to-earnings valuation ratio.
All index data from FactSet.
This research material has been prepared by LPL Financial LLC.
Securities and advisory services offered through LPL Financial (LPL), a registered inv estment advisor and broker -dealer (member FINRA/SIPC). Insurance products are offered through LPL or its licensed affiliates. To the extent you are receiving investment a dvice from a separately registered independent investment advisor that is not an LPL affiliate, please note LPL makes no representation with respect to such entity.
Not Insured by FDIC/NCUA or Any Other Government Agency | Not Bank/Credit Union Guaranteed | Not Bank/Credit Union Deposits or Obligations | May Lose Value
RES-1268800-0922 | For Public Use | Tracking # 1-05327394 (Exp. 09/23)