
Midterm elections are upon us, with Election Day on Tuesday. Republicans are strongly favored to win the House, and the Senate is roughly a tossup. We believe either outcome would be market-friendly, although the bigger market driver will likely be central banks’ efforts to tame inflation. In this week’s Weekly Market Commentary, we look at why the stock market may respond favorably to the midterm election, whatever the outcome.
Tuesday, November 8 is Election Day, although early voting has been taking place in some states since late September. Every member of the House is up for reelection, and 34 of the 100 members of the Senate are up for reelection. Currently, Democrats hold a narrow majority in the House of just five seats and the narrowest possible majority in the Senate, a 50-50 split with Vice President Harris breaking the tie as president of the Senate. All federal elections are consequential and we encourage all our readers to go out and vote, but as always at LPL Research, our focus is on potential market consequences.
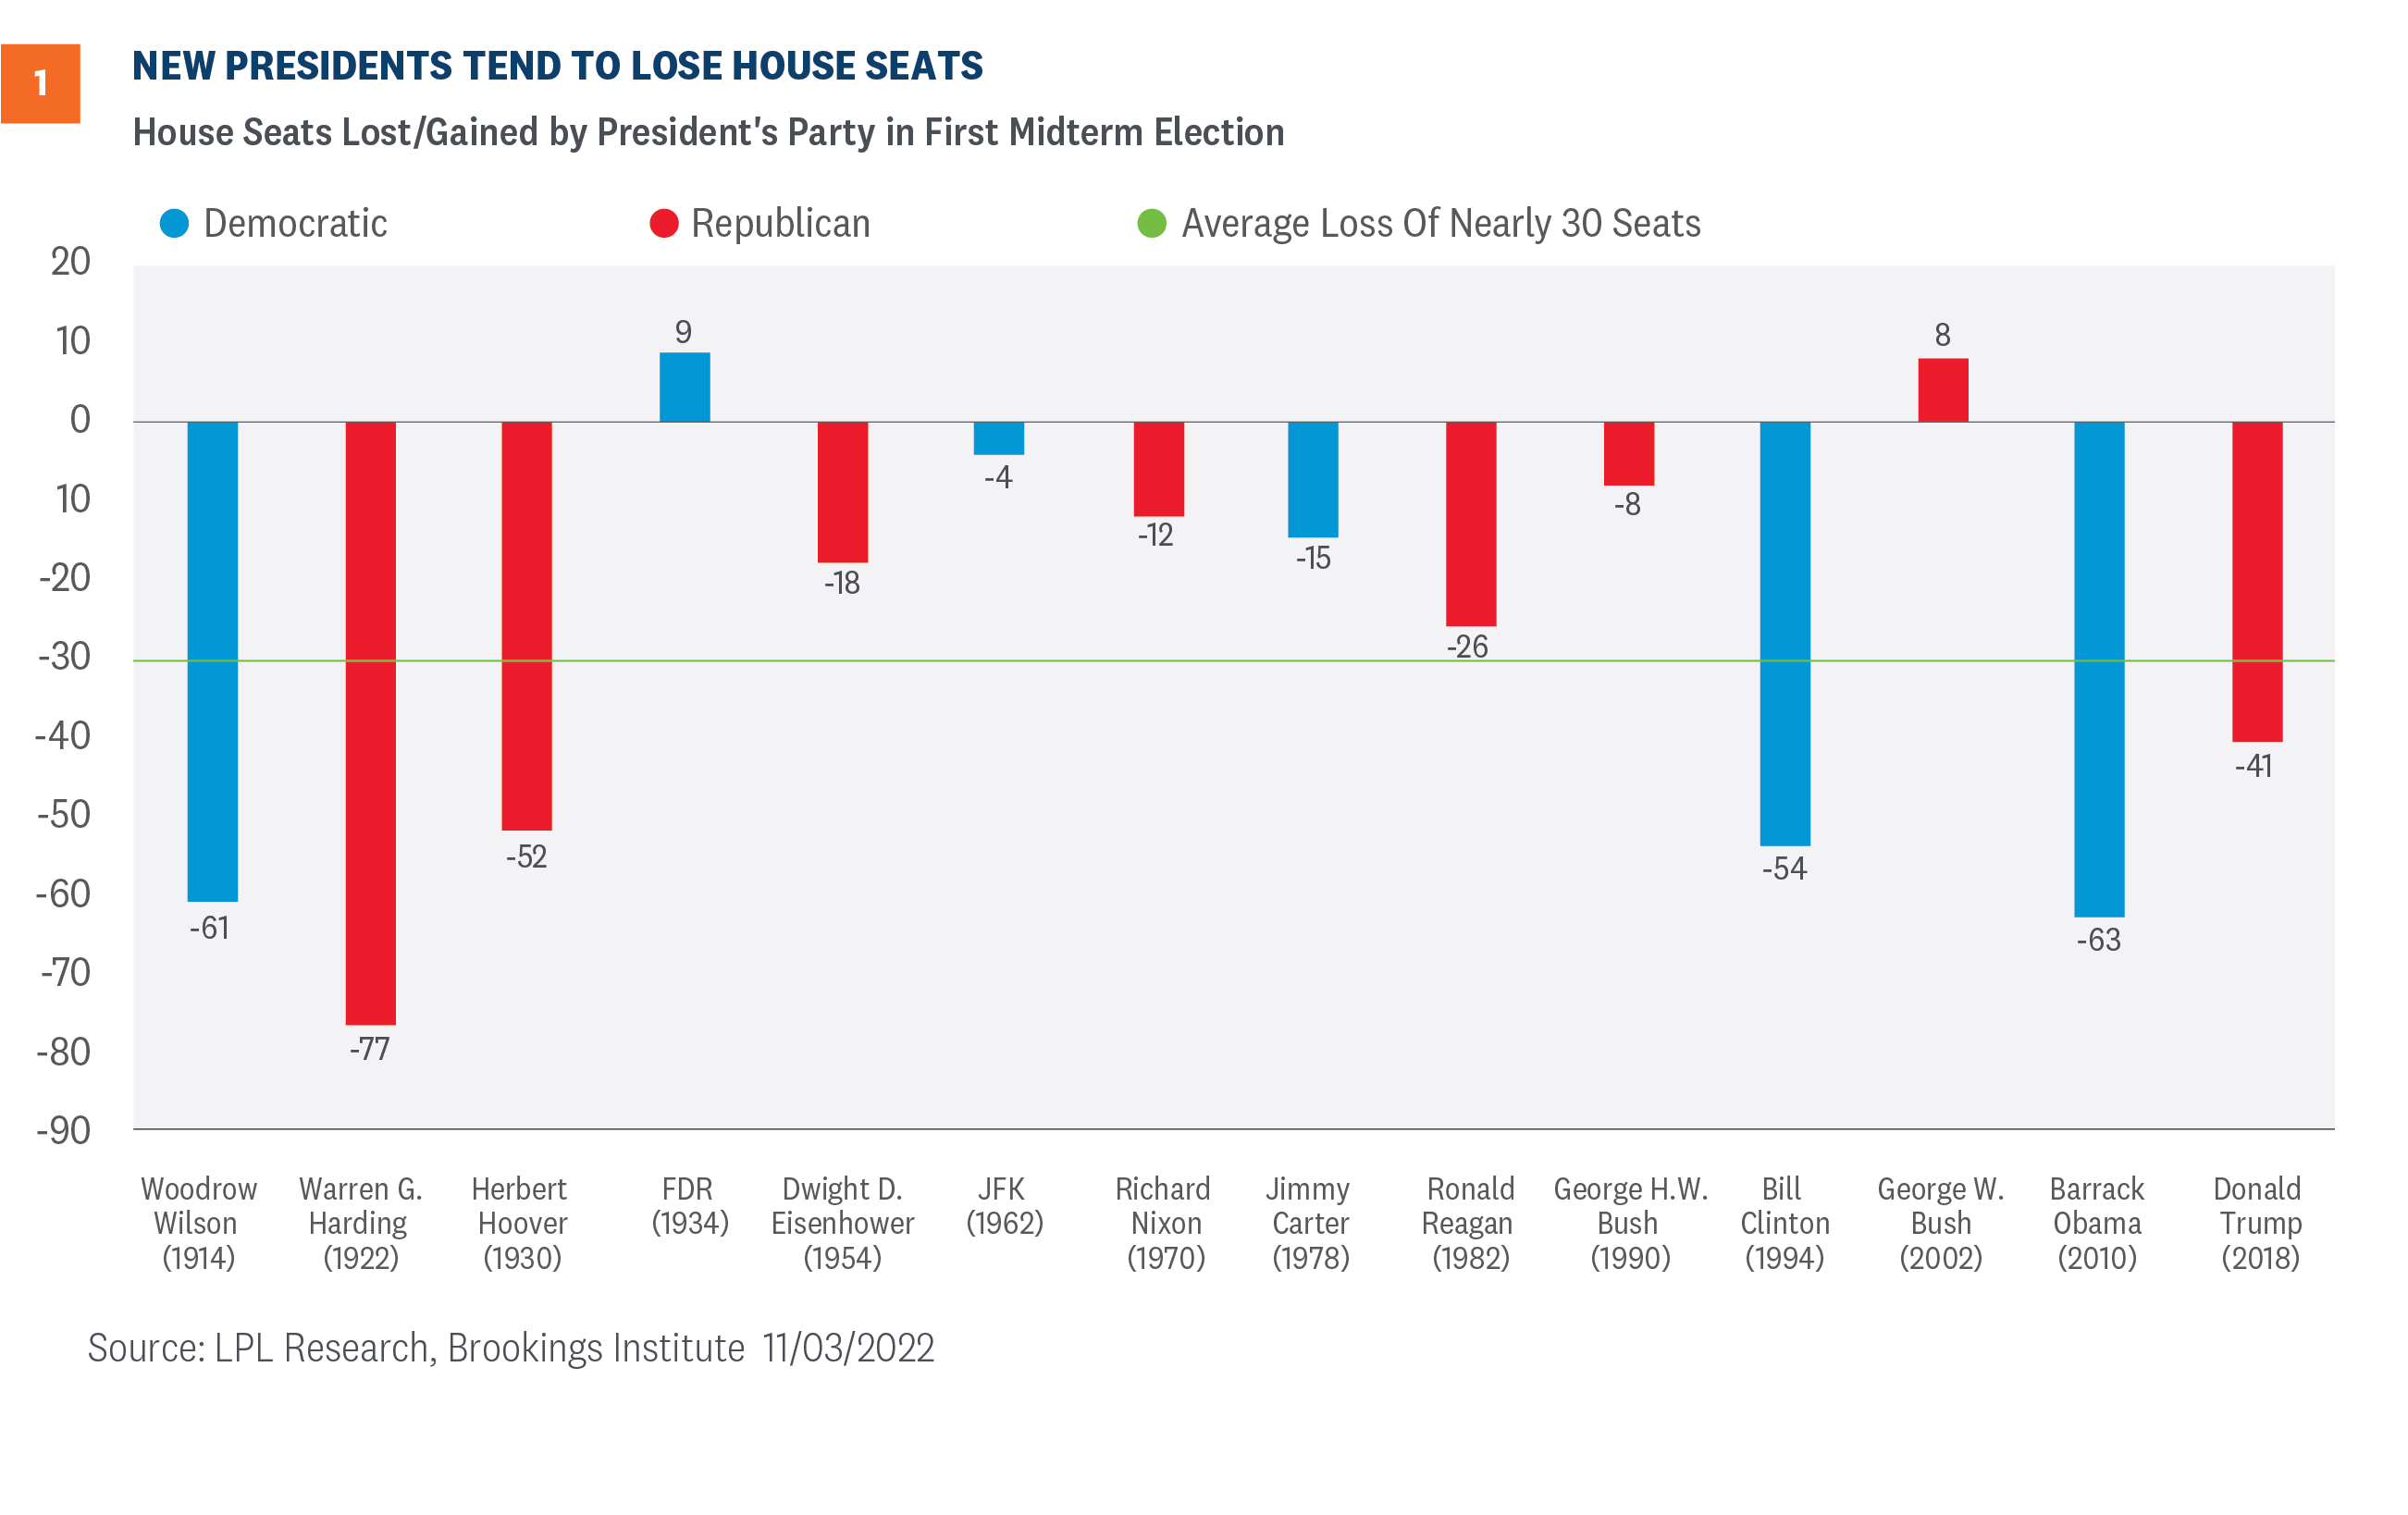
While we would never consider any election a lock no matter what the pollsters say, Republicans are very solid favorites to retake the House. This alone would be enough to give us a mixed government, where a party different from the president’s controls at least one Chamber of Congress. If we knew nothing else, Republicans would be favored simply because the sitting president is a Democrat. New presidents almost always lose House seats during midterms. In fact, since 1914, new presidents have lost an average of 30 seats and have only picked up seats twice [Figure 1]. On top of that, President Biden faces a low approval rating, sitting at about the same level as President Trump’s when he faced a wave election. With the economy exhibiting low growth and generationally high inflation, these additional factors point to the House very likely flipping with some possibility of a wave election for Republicans.
As we head into Election Day, Republicans are favored to pick up about 15-20 seats, or 10-15 more than needed to take control of the House. An even larger pick-up is likely well in play with a 30-seat pick-up, roughly the point at which this might be called a wave election. This would signal a major change in political sentiment (depending on what happens in the Senate). If the Republicans net 10 seats or fewer, the narrative will likely be Republicans underperformed. But we’ll leave the spin to the pundits. Either way, Republicans are strongly favored to control the House, although election surprises do happen.
The Senate is always more complicated. Only about 1/3 of Senate seats are in play each election, and while Senate results do tend to tilt against the president’s party, a lot can depend on who is up for election in a particular cycle. This year 35 seats are up for election, 21 held by Republicans and 14 held by Democrats, but most of those seats are safe on both sides. The consensus is that there are three key seats close to being a tossup: a Republican seat in Pennsylvania, where the current Senator is not running for reelection, and Democratic seats in Georgia and Nevada. Whoever wins two out of three probably takes control of the Senate. There are a few other seats within typical polling error of being able to go either way, but those three races will likely tell us how the evening goes.
Just to add a twist, if no candidate wins an outright majority in Georgia (more than 50% of the votes cast), it will go to a run-off, which would be held on December 6. Georgia’s Libertarian candidate is expected to receive 1-2% of the vote and polling has been tight, so it’s certainly a possibility. These runoffs do happen: In 2022 both Georgia Senate seats went to a runoff, as did Georgia Senate election in 1992 and 2008.
The big takeaways for markets: don’t depend on the senate
Historically, there are two key general takeaways from midterms: 1) Markets like them to be over and 2) Markets prefer mixed government. The first one is just a matter of time passing. The second is in play if Republicans take the House, independent of what happens in the Senate.
Markets historically have done well in the year after midterms [Figure 2]. In fact, they have been higher 18 out of 18 times in the following year dating back to 1950, with nearly identical historical returns under Democratic and Republican presidents. This is no guarantee that it will happen this time, of course, and remember, the S&P 500 has been higher about 80% of all years over that span, so 18 out of 18 is only somewhat above expectations. Still, there are a few possible fundamental reasons for market strength following midterm elections. Primarily, the uncertainty associated with the election is behind us, and markets don’t like uncertainty. But on top of that, midterms usually provide something of a course correction from presidential elections, as discussed above, and markets may anticipate prospects of a better policy balance ahead, regardless of who is in the Oval Office.
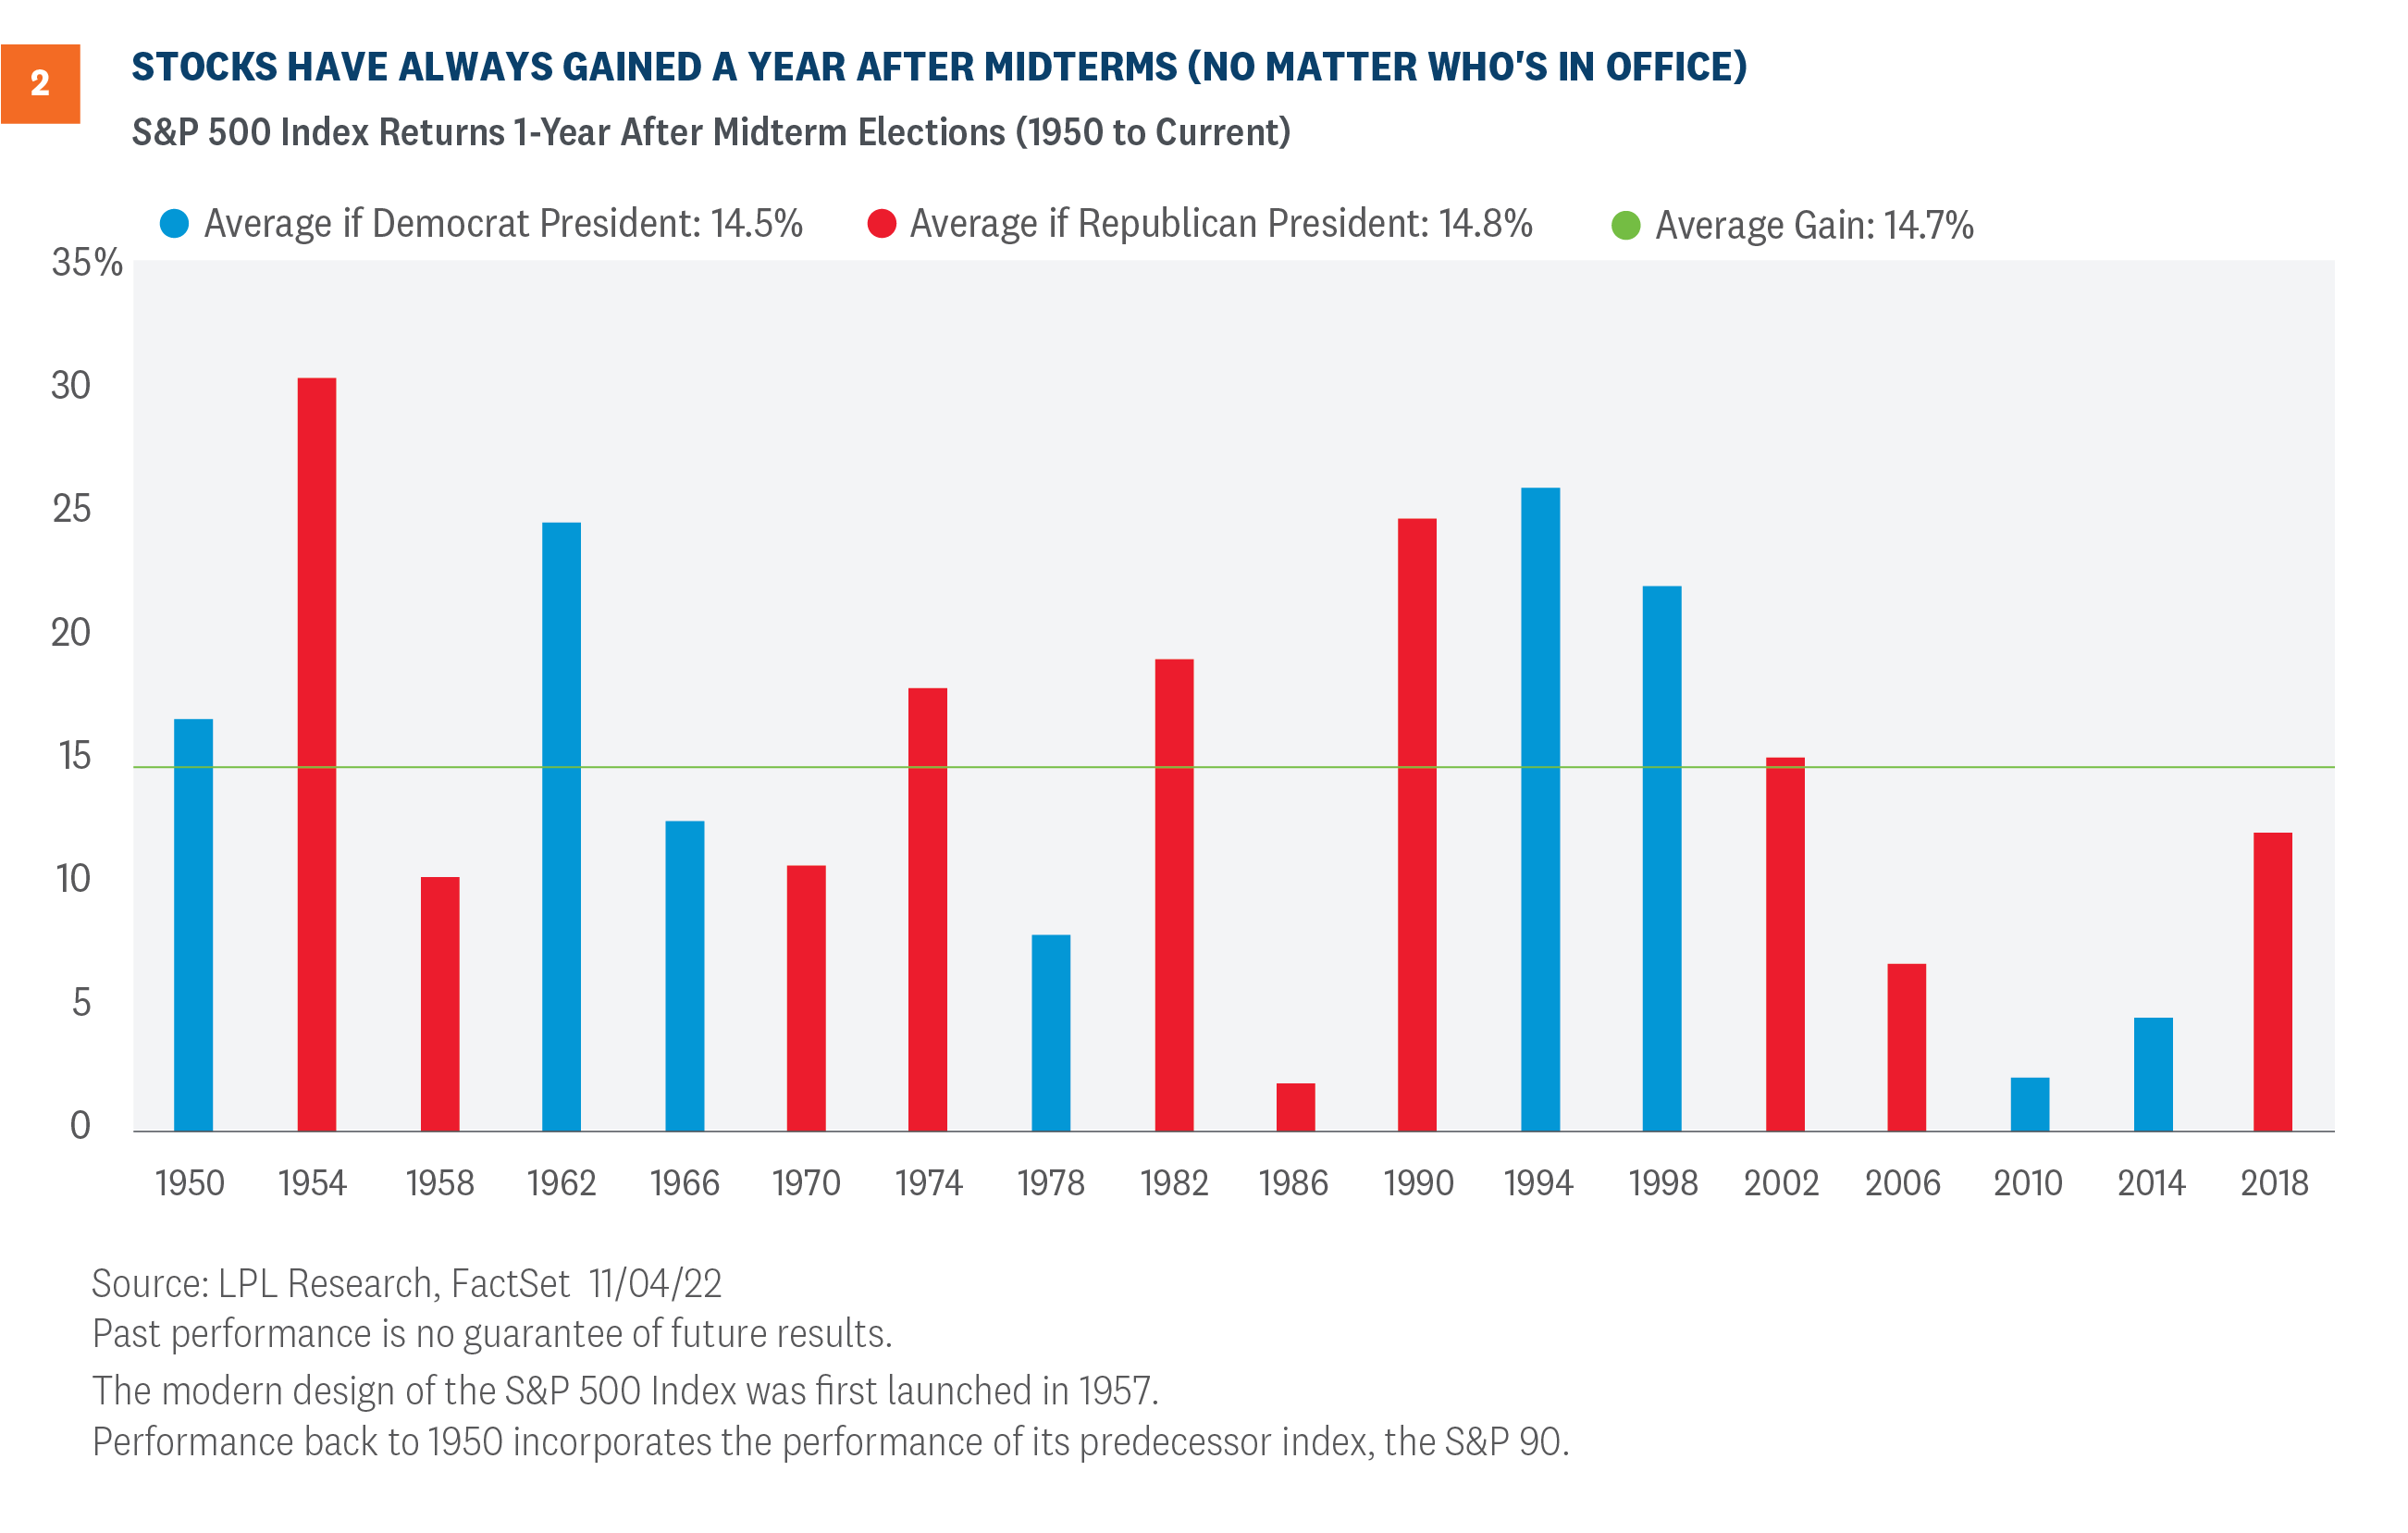
When it comes to mixed government and markets, the historical data has been strong, although there’s still a fair amount of variation depending on individual circumstances. Going back to 1951, a Democratic president with a Republican or split congress, the two most likely cases this election, has seen an average S&P 500 Index return of over 17% versus an overall average of just over 12%. A split congress and a Republican president has also seen strong returns. The major exception to a mixed government working has been a Republican president and a Democratic Congress, which we saw for most of Eisenhower’s administration, as well as under Nixon and Ford, but that’s not a combination we’re currently facing.
Policy changes will be more about what doesn’t get done
Outside of a mixed government and simply getting the election behind us,, we don’t expect many policy changes that might incrementally affect markets coming out of the election, even if Republicans win both the House and the Senate. Policy itself can be difficult to forecast, and economic factors often overwhelm the impact on markets. For instance, the Trump administration was friendlier to energy sector profits than the Biden administration, but the sector’s stock performance stumbled under Trump and has soared under Biden. The policy implications were correct, but more important performance drivers were in play. Nevertheless, there will be some things to watch for:
- Perhaps the biggest policy implication is simply that it will be harder to pass any legislation if we have a mixed government. This would take any meaningful risk of tax increases on households or businesses off the table.
- There is typically incremental improvement to the policy environment for financials, energy, and defense when Republicans hold more power and incremental improvement for healthcare under Democrats. But as seen in the energy example above, larger economic forces tend to be more meaningful.
- If Republicans win the Senate, appointments to key posts that require Senate approval will be more centrist, with more controversial nominees likely not even being put forward for confirmation.
- The path to raising the debt ceiling may become more difficult, and markets have usually reacted negatively when it starts to look possible that the U.S. will default on its debt.
- The policy environment may be somewhat friendlier to mergers and acquisitions.
- A recession may be incrementally deeper, if we have one, due to a smaller fiscal response.
Conclusion
We expect the impact of the election to tilt the market positive, partly because we’ll have it behind us. Markets have also tended to favor mixed government, especially Democratic presidents with Republican or split Congress, which is our most likely outcome. As far as markets are concerned, the policy impact is likely to be small, and market participants will continue to be more focused on central bank policy and inflation. Of course, the outcome is always uncertain, and there are election surprises. Polls and models don’t cast ballots, people do, and the models have always been more uncertain than they are given credit for. Our best advice: Just go and vote.
Jeffrey Buchbinder, CFA, Chief Equity Strategist, LPL Financial
Barry Gilbert, PhD, CFA, Asset Allocation Strategist, LPL Financial
You may also be interested in:
- Federal Reserve Preview: TRICK or Treat? – October 31, 2022
- Three Things to Know About Recessions – October 24, 2022
- Low Bar for Earnings Season Brings Third Quarter Expectations Down – October 17, 2022
Click here to download a PDF of this report.
IMPORTANT DISCLOSURES
This material is for general information only and is not intended to provide specific advice or recommendations for any individual. There is no assurance that the views or strategies discussed are suitable for all investors or will yield positive outcomes. Investing involves risks including possible loss of principal. Any economic forecasts set forth may not develop as predicted and are subject to change.
References to markets, asset classes, and sectors are generally regarding the corresponding market index. Indexes are unmanaged statistical composites and cannot be invested into directly. Index performance is not indicative of the performance of any investment and do not reflect fees, expenses, or sales charges. All performance referenced is historical and is no guarantee of future results.
Any company names noted herein are for educational purposes only and not an indication of trading intent or a solicitation of their products or services. LPL Financial doesn’t provide research on individual equities.
All information is believed to be from reliable sources; however, LPL Financial makes no representation as to its completeness or accuracy.
US Treasuries may be considered “safe haven” investments but do carry some degree of risk including interest rate, credit, and market risk. Bonds are subject to market and interest rate risk if sold prior to maturity. Bond values will decline as interest rates rise and bonds are subject to availability and change in price.
The Standard & Poor’s 500 Index (S&P500) is a capitalization-weighted index of 500 stocks designed to measure performance of the broad domestic economy through changes in the aggregate market value of 500 stocks representing all major industries.
The PE ratio (price-to-earnings ratio) is a measure of the price paid for a share relative to the annual net income or profit earned by the firm per share. It is a financial ratio used for valuation: a higher PE ratio means that investors are paying more for each unit of net income, so the stock is more expensive compared to one with lower PE ratio.
Earnings per share (EPS) is the portion of a company’s profit allocated to each outstanding share of common stock. EPS serves as an indicator of a company’s profitability. Earnings per share is generally considered to be the single most important variable in determining a share’s price. It is also a major component used to calculate the price-to-earnings valuation ratio.
All index data from FactSet.
This research material has been prepared by LPL Financial LLC.
Securities and advisory services offered through LPL Financial (LPL), a registered inv estment advisor and broker -dealer (member FINRA/SIPC). Insurance products are offered through LPL or its licensed affiliates. To the extent you are receiving investment a dvice from a separately registered independent investment advisor that is not an LPL affiliate, please note LPL makes no representation with respect to such entity.
Not Insured by FDIC/NCUA or Any Other Government Agency | Not Bank/Credit Union Guaranteed | Not Bank/Credit Union Deposits or Obligations | May Lose Value
RES-1327050-1122 | For Public Use | Tracking # 1-05344994 (Exp. 11/23)